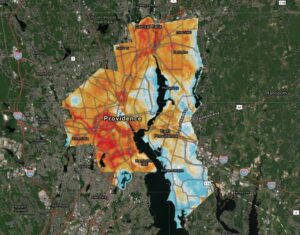


Providence, as a whole, celebrates diversity – of ethnicity, origin, language, culture. The city consists of 25 defined neighborhoods and thousands of blocks – each one different from the others. The Providence Planning Dept. maintains a wonderful resource for exploring our differences and similarities, its Neighborhood Snapshots web page. They’ve done the hard work of combining basic US Census block data into neighborhood numbers. We’ve pulled out the neighborhoods that rank highest and lowest in a few categories and compared them to our citywide average. Don’t see your neighborhood? – go to Neighborhood Snapshots for yourself.
People per square mile:
18,200 West End
2,100 South Elmwood
9,751 – Citywide average
Median age
44.5 – Blackstone
22.5 – College Hill
31 – Citywide Average
Population of color
97% – Lower South Providence
20% – Blackstone
66% – Citywide Average
Percent of Spanish-speaking population
59.7% – Elmwood
2.2% – Blackstone
35% – Citywide average
Unemployment rate
20.8% – Upper South Providence
3.2% – Wayland
4.4% – Citywide average
Vacant housing units
25.8% – Olneyville
5.6 % – Reservoir
14% – Citywide average
Proximity to Supermarkets and Parks

Jonathan Howard is Co-founder of Cause & Effect, Inc., a consulting company that provides strategic planning facilitation, fund development planning and board strengthening to mission-driven organizations. He is a long- time resident of Providence. His three children all attended Providence Public Schools from kindergarten through high school.
Want to comment? Click!