
Providence Counts assembles facts and figures from a variety of sources to illustrate different aspects of the city.
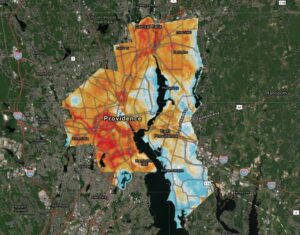
Exactly like our wealth, Providence’s trees are spread very unevenly across our city. The scarcity of trees by neighborhood is closely correlated to income, race, rates of asthma, summer heat island effects and vulnerability to flooding. The ambitious PVD Tree Plan, launched in December, envisions a 25-year path toward a greener, healthier future for Providence’s low-income neighborhoods and communities of color. Here are a few data points; take a look at the whole plan.
27%: Percent of Providence land covered by tree canopy (2018), a gain of 4% from 2011.
30%: Percent of Providence land covered by asphalt.
59%: Percent of Providence land area covered by impermeable (waterproof) surfaces including asphalt, cement and buildings.
51% or more: Percent of tree canopy cover in Providence’s highest-income neigbhorhoods.
10% or less: Percent of tree canopy cover in Providence’s lowest-income neighborhoods.
415,000: Estimated number of trees in the city of Providence.
91: Tons of air pollution removed from our air each year by our urban forest.
31.5 million: Gallons of polluted stormwater runoff diverted from storm drains each year by Providence trees.
124,000: Tons of carbon stored in Providence trees, equal to the annual carbon emissions of 74,100 cars.
507 – PVD Tree Plan goal for acres of new tree canopy to be added in priority tree equity areas over the next 25 years, a gain of 50% in Providence neighborhoods with the greatest need for tree equity.
3,038 –Trees to be planted annually over the next 10 years to achieve the PVD Tree Plan goal.

Sources:
PVD Tree Plan,
Mapping Tree Inequality, an informational zine from the PVD Tree Plan Team.
Want to comment? Click!